When your Windows 11 system crashes or an application fails without warning, it can be difficult to determine what went wrong. Sometimes the only visible symptom is a frozen screen, a blue screen error (BSOD), or an app that closes abruptly. Rather than guessing the cause, Windows offers a powerful built-in diagnostic tool: Event Viewer.
Event Viewer is a logging system that tracks every major action and error occurring on your computer. It provides valuable insights into system behavior, including crash causes, failed services, driver issues, and software conflicts. Knowing how to use it can save you hours of troubleshooting time.
This guide walks you through the process of checking Event Viewer for crash clues in Windows 11, helping you pinpoint issues more efficiently.
What Is Event Viewer?
Event Viewer is a Windows utility that logs detailed information about the system’s operations. It categorizes events into types like:
- Information – Successful operations and updates.
- Warning – Issues that might become problematic.
- Error – Events indicating a failed operation.
- Critical – Severe events that may result in system instability or crashes.
These logs are divided into channels such as Application, System, Security, and Setup, with the System and Application logs being most useful for crash analysis.
How to Open Event Viewer in Windows 11
There are several ways to access Event Viewer:
Method 1: Use the Start Menu
- Click the Start button.
- Type Event Viewer in the search bar.
- Select the Event Viewer app from the results.
Method 2: Use Run Command
- Press Windows + R to open the Run dialog.
- Type eventvwr and press Enter.
Once opened, you’ll see a navigation panel on the left and a detailed event list on the right.
Step-by-Step: Checking for Crash Logs
To track down a crash using Event Viewer, follow these steps:
Step 1: Navigate to Windows Logs
In the left-hand pane:
- Expand Windows Logs.
- Click on System for hardware or driver-related crashes.
- Click on Application for software-related failures.
These sections contain time-stamped records of all significant events.
Step 2: Filter for Critical or Error Events
Scrolling through logs can be overwhelming, so it helps to filter by severity.
- In the Actions pane (right side), click Filter Current Log.
- In the popup window, check Critical, Error, and optionally Warning.
- Set a date range if you know when the crash occurred.
- Click OK to apply the filter.
Now you’ll see only relevant events, making it easier to locate the one tied to your system crash or software failure.
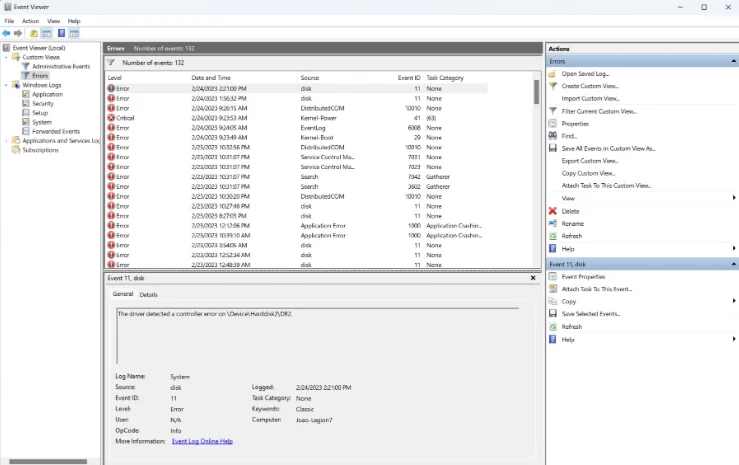
Step 3: Identify the Faulty Source
Each event entry includes a Source, Event ID, and Description.
Pay special attention to these fields:
- Source: Indicates the component that triggered the error (e.g., Application Error, Disk, Kernel-Power, Display, etc.).
- Event ID: A numeric code that corresponds to a specific type of failure.
- Details: Clicking an event will display its full description in the lower pane. This often includes the name of the failing app or service, the error code, and additional context.
Common Event IDs to Watch
While not exhaustive, here are a few commonly associated Event IDs for crashes:
- 1000 – Application Error: Often signals when a specific program crashed.
- 41 – Kernel-Power: Indicates a system reboot caused by power loss or a fatal crash.
- 6008 – Unexpected Shutdown: Logged after an improper system shutdown.
- 2004 – Resource Exhaustion Detector: Suggests memory issues or leaks.
Each ID is searchable online, where you can find community discussions and official Microsoft documentation on how to interpret them.
Step 4: Investigate the Event Details
Once you’ve identified a suspicious event:
- Double-click the event to open a detailed window.
- Look at Faulting Application Name, Faulting Module, and Exception Code.
- Copy or note these details for further research.
For example, an exception code like 0xc0000005 often points to memory access violations, which can be caused by bad drivers, corrupt system files, or hardware issues.
Step 5: Use Event Viewer with Reliability Monitor
To get a broader context, combine Event Viewer analysis with Reliability Monitor—another diagnostic tool in Windows 11.
To access:
- Type Reliability Monitor into the Start menu and select View reliability history.
- Locate recent critical events or application failures.
- Click on a specific failure to view technical details and a link to the associated Event Viewer log.
This tool gives a timeline of system stability, making it easier to connect specific crashes with recent software installations or driver updates.
Step 6: Export and Share Event Logs (Optional)
If you’re working with IT support or posting on technical forums:
- In Event Viewer, right-click the relevant log category (e.g., System).
- Select Save All Events As….
- Save the file with a recognizable name and share it with support personnel.
This allows others to analyze the raw data and provide targeted advice.
What to Do After Identifying the Cause
Once you’ve identified the source of the crash, consider these next steps:
- Update drivers (especially graphics, chipset, or network drivers).
- Run System File Checker (sfc /scannow) to repair corrupt system files.
- Uninstall or reinstall the crashing application.
- Check hardware health with diagnostics if the issue points to memory or disk errors.
- Apply Windows Updates to ensure system-level patches are current.
If multiple Event IDs point to the same error source, you’ve likely found the culprit.