App crashes, screen freezes, battery drain, and lag—these issues can frustrate users and make even a powerful Android phone feel unreliable. But Android isn’t a black box. Hidden within its settings lies a powerful toolkit: Developer Options.
While intended for developers, savvy users and testers can use these tools to track down app instability, identify culprits, and sometimes even fix the problem themselves.
Unlocking Developer Options
Before anything else, you’ll need to enable Developer Options. It’s easy and safe to do.
Steps to Enable Developer Options:
- Go to Settings > About phone.
- Scroll to Build number.
- Tap Build number 7 times. You may need to enter your PIN or password.
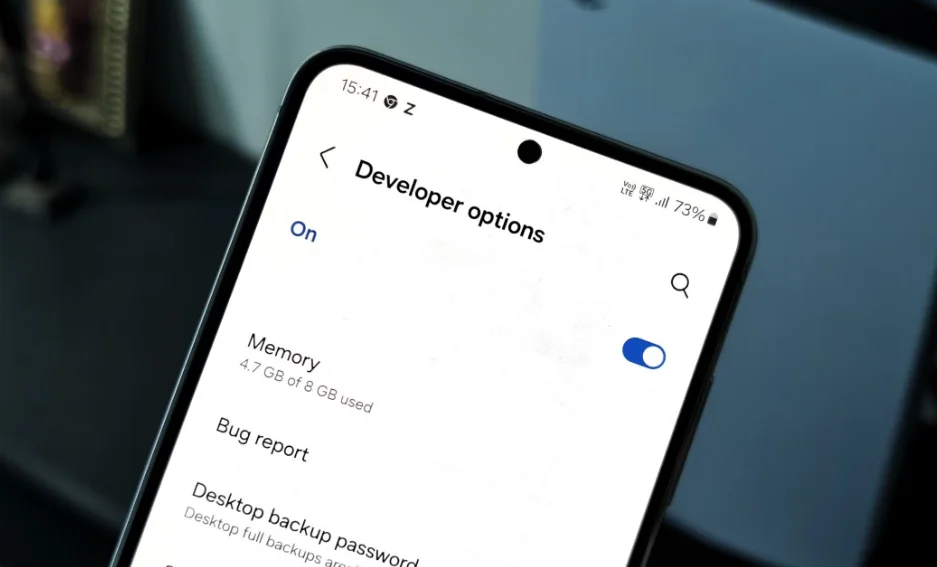
- Go back to Settings > System > Developer options (exact path may vary by device/brand).
Now you’re ready to explore the tools that can help you diagnose app instability.
Top Developer Options for Troubleshooting App Issues
Below is a table of the most useful Developer Options features for identifying app instability, followed by detailed explanations and use cases.
| Feature | Use Case |
|---|---|
| Show CPU Usage | View real-time CPU load per app |
| Profile GPU Rendering | Detect UI lag or rendering delays |
| Background Process Limit | Check if too many apps are running simultaneously |
| Don’t Keep Activities | Identify apps that mismanage state saving and crash on reload |
| Strict Mode Enabled | Detect apps performing heavy operations on the main thread |
| Show Layout Bounds | Reveal broken or misaligned UI layouts that may cause crashes |
| Bug Report Shortcut | Capture logs immediately after a crash |
| Running Services | Monitor memory and service usage for signs of leaks |
1. Show CPU Usage
When an app is unstable, it often spikes CPU usage before crashing. Enabling CPU usage overlays shows real-time system load and the processes consuming resources.
How to Use:
- Turn on Show CPU usage.
- Open the problematic app.
- Watch for CPU spikes or sustained high usage.
What to Look For:
- CPU usage pinned above 90% for long periods.
- One app consuming disproportionately high resources.
- Spikes when tapping buttons or switching views.
Use Case: Identifying if an app is overworking the CPU (e.g., poorly optimized animations, infinite loops).
2. Profile GPU Rendering
Lag or stuttering in UI may signal rendering problems. This feature visualizes how long each frame takes to draw.
How to Use:
- Enable Profile GPU rendering > Choose On screen as bars.
- Open the app and interact with its interface.
What to Look For:
- Bars rising above the green line (16ms/frame) mean the UI isn’t rendering smoothly.
- Spikes during scrolling or animation transitions.
Use Case: Diagnosing UI bottlenecks, especially in graph-heavy or animation-rich apps.
3. Background Process Limit
Too many background processes can drain RAM and cause app instability. Limiting background processes helps test if memory contention is the issue.
How to Use:
- Set Background process limit to 2 or 3.
- Open the suspect app and use it for a while.
- Observe if crashes stop.
Use Case: Identifying issues caused by aggressive multitasking or background services interfering with foreground apps.
4. Don’t Keep Activities
This setting forces every app to be destroyed as soon as it goes into the background. It’s a harsh test, but one that reveals poor lifecycle management.
How to Use:
- Turn on Don’t keep activities.
- Switch between apps or rotate the screen.
What to Look For:
- Apps crash or restart without saving data.
- Errors loading the app’s state or navigation bugs.
Use Case: Testing if apps can gracefully handle state destruction and recreation.
5. Strict Mode Enabled
Strict mode flashes the screen red whenever an app does heavy work on the main UI thread—something that shouldn’t happen and often leads to ANRs (App Not Responding) or jank.
How to Use:
- Enable Strict mode enabled.
- Use the app normally.
What to Look For:
- Screen flashes during scrolling, typing, or UI updates.
Use Case: Catching developers who block the main thread with file I/O, networking, or complex calculations.
6. Show Layout Bounds
While not directly tied to crashes, poor layout management can cause rendering failures or unresponsive views.
How to Use:
- Enable Show layout bounds.
- Navigate through the app.
What to Look For:
- Overlapping elements.
- Invisible but active views consuming touch input.
- Weird UI behavior tied to layout misconfigurations.
Use Case: Debugging crashes triggered by malformed UI or screen orientation changes.
7. Bug Report Shortcut
You can generate a full system log after a crash using this feature.
How to Use:
- Enable Take bug report shortcut.
- After a crash, hold the Power button, then tap Bug Report.
- Wait for report generation and share via email or cloud.
Use Case: Advanced diagnosis or when sending logs to a developer or support team.
8. Running Services
Accessible under Developer Options (or via Settings > Apps > Running services), this shows live data on which services are running and how much memory they use.
What to Look For:
- Services that shouldn’t be running (e.g., inactive apps).
- Memory-hogging background processes.
- Apps that stay resident and don’t release memory.
Use Case: Identifying memory leaks or rogue background services that destabilize the system.
Tips for Effective Diagnosis
- Recreate the problem with Developer Options enabled. Don’t just toggle settings—observe behavior during real use.
- Compare across apps. If one app consistently crashes while others don’t under the same conditions, it’s likely the app’s fault.
- Cross-reference with logs if available, especially with logcat or ADB if you’re comfortable using Android Studio.
What Developer Options Can’t Fix
Developer Options are diagnostic tools—not magic fixes. If you discover that an app is poorly built or leaks memory, you can’t fix its code. But you can:
- Report detailed feedback to the developer.
- Avoid using unstable features in the app.
- Use alternatives until a fix arrives.
Power Tools for Smart Users
Android’s Developer Options aren’t just for developers. Anyone with a bit of patience and curiosity can use them to track down app instability, whether it’s caused by bad coding, device limitations, or excessive background tasks. These tools won’t solve every problem, but they can help you zero in on what’s wrong—especially when app support or generic troubleshooting falls short.
Armed with insights from Developer Options, you’re better equipped to make informed decisions: keep, replace, report, or simply avoid unstable apps that degrade your Android experience.